
In the last week, we have seen that bitcoin is still in the congestion of the US$ 20,000 zone. Thus, the Transfero team thoroughly analyzed the possible scenarios for the short term of this asset.
“Given that there is the configuration of a rectangle on the daily chart, a figure that characterizes a lateral rest of the asset price, it is worth considering that when there is a breakout of one of the extremities of this figure, the BTC should continue the movement. The projected targets, in case of a break up or break down, are marked on the figure.
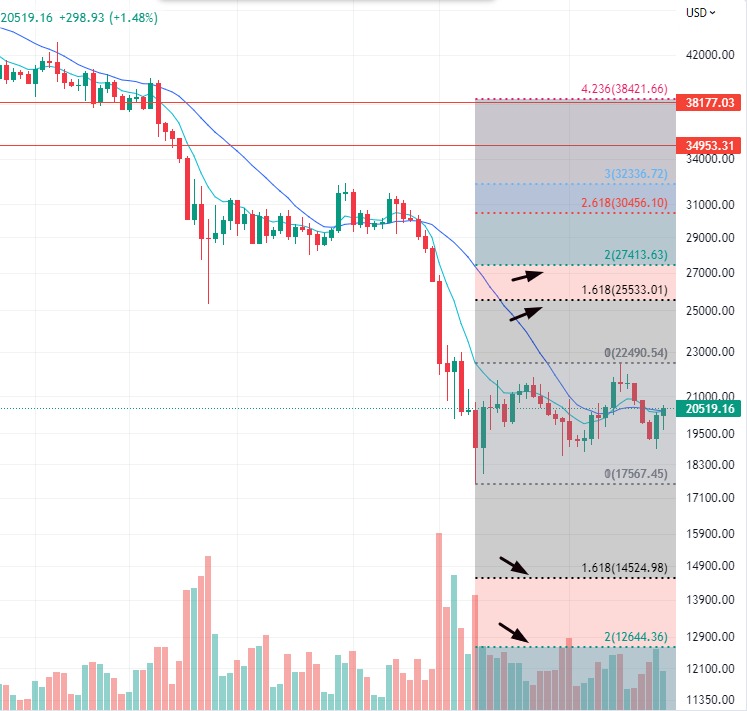
It is worth explaining that the rectangle is a figure that characterizes lateralization, the indetermination of the price movement of a certain asset, usually occurring after strong directional movements. The lower base is considered support and the upper resistance for prices. If either of these extremities is broken, there is a probability that the asset will continue the movement until a projection of the same size as the previously drawn rectangle.
Supporting last week’s analysis, the mathematical expectation is favorable for recovery this July, given the historical data of bitcoin profitability in this period, considering the previous ten years.
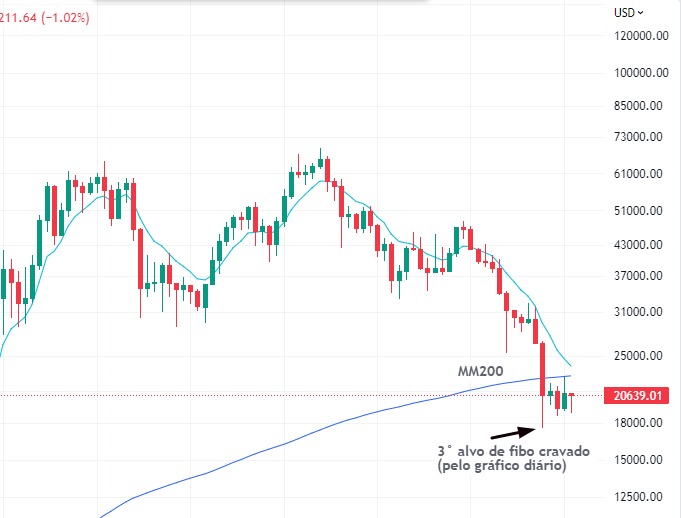
From the weekly chart perspective, the 200-period average is still seen as a solid barrier to the price, even more so with its upward slope. Not to mention the collaboration of the previous tops marked in the year 2018 by this crypto. That being the case, a sideways correction or even a bullish move is totally healthy and plausible for BTC.