
This week’s bitcoin analysis does not bring much news concerning the previous one, as bitcoin continues in that US$19,000 accumulation range. It is known from the chart analysis that the longer the period of this accumulation, the greater the speed that prices will move when it is broken, regardless of whether it is by support below or resistance above the rectangle, as shown in the figure below.
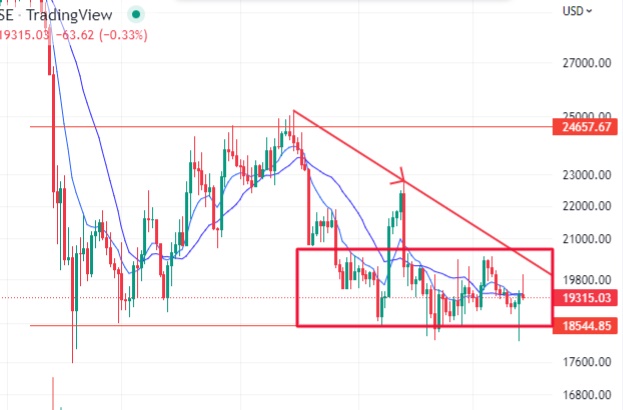
Chart generated by TradingView
The chart summarizes bitcoin’s movement within a ‘box’ characterized as a lateralized move. It is worth noting that the asset comes from a downtrend by the weekly chart that defines the guideline of the crypto asset in the medium-term horizon.
If the investor believes in the recovery of the asset in the medium/long term, considering that it has already fallen approximately 70% since the all-time high price and that there is a possibility of returning to this level, the region of US$19,000 becomes quite attractive with a potential for a valuation up to US$70,000, something close to 260%.