
In the last seven days, ending July 21, there has been a breakout of the structure mentioned in the previous week, which characterized a lateralization move in the price of bitcoin.
With this, the crypto asset has made room to seek higher levels in the near term, which the daily chart can identify.
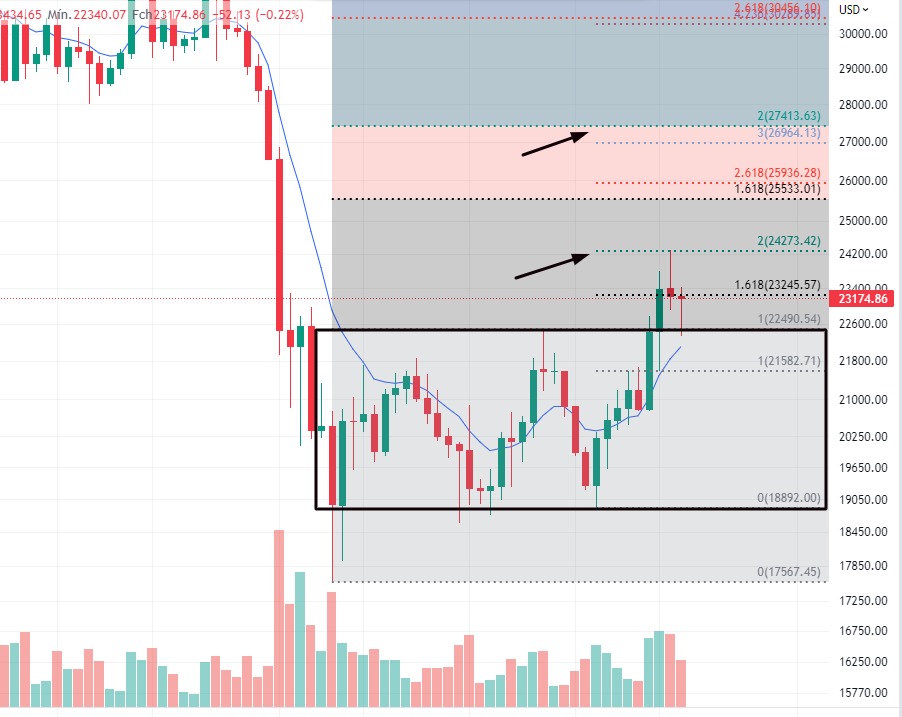
Chart generated by TradingView
It is worth noting that no chart should be used by itself only. According to Transfero’s Research team, utilizing the confluence between charts of different periodicities is essential.
That said, looking at the weekly, medium-term chart, it is seen that the nine-period exponential moving average served as a barrier to price movement.
Thus, the trend remains downward on this horizon but with a more robust correction of crypto assets, perceived by this bullish movement.
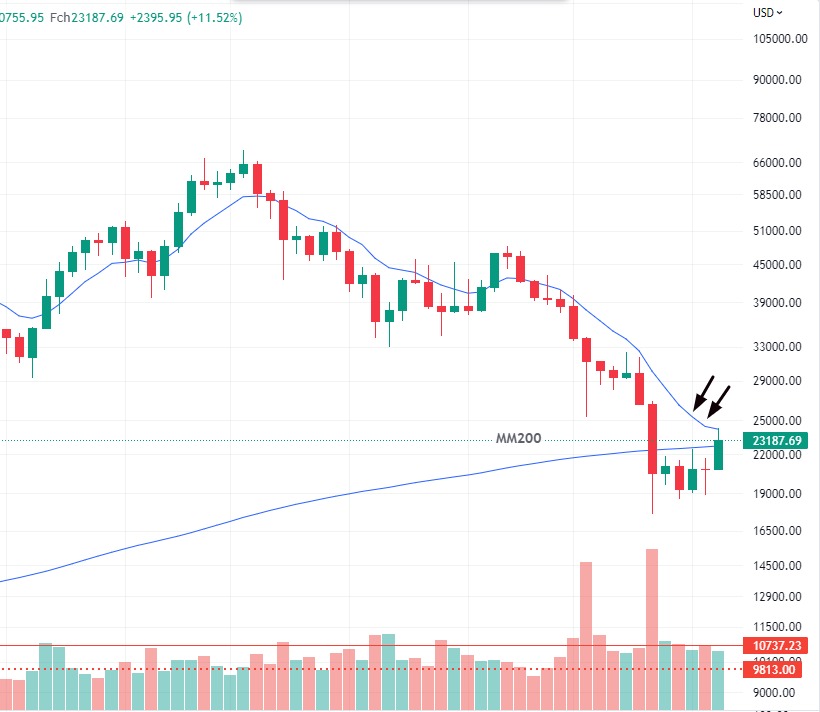
Chart generated by TradingView
“As we are approaching the end of the month, the positive mathematical statistic of this period of the last 10 years is being confirmed, given this rise of approximately 17% in the bitcoin price since the beginning of the month”, notes the Transfero team.