
After distancing itself from the US$ 23,000 mark on August 19, bitcoin has begun to draw downward tops and bottoms, which can be seen in the daily chart analysis.
This week (between September 1 and 8), the crypto asset lost the US$ 20,000 level, falling to US$ 18,500. If the trend is not reversed, the next stop is US$ 17,500, which was recorded on June 18. The third target of the bearish flag has already been reached, as seen in the figure below.
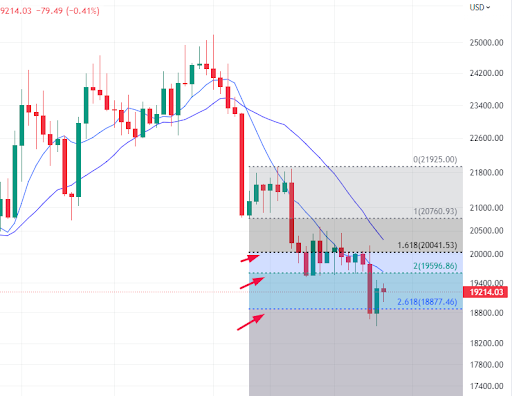
Chart generated by TradingView
However, if this level is lost, BTC makes room to pursue the targets set in the chart below:
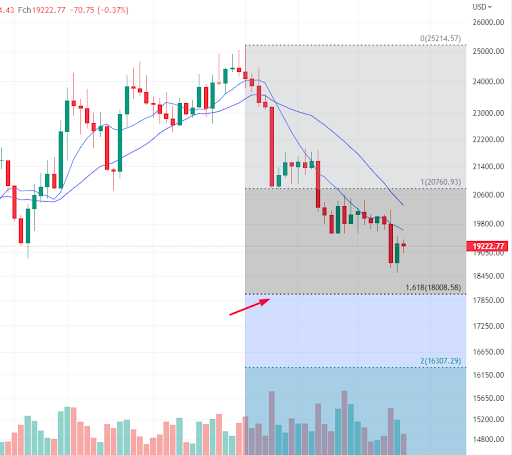
Chart generated by TradingView
From a medium-term perspective, the weekly chart presents two possibilities. The first is a continuation of the downtrend, and the other is a possible reversal – for which the BTC chart analysis would have to draw a double bottom or bullish pivot. The barriers to the asset are marked in the following image.
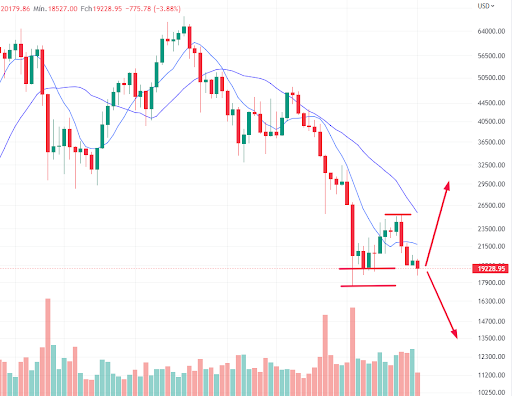
Chart generated by TradingView