
After a long period of lateralization movement, bitcoin has exceeded the US$ 20,000 region and opened the way to take greater strides, possibly reaching US$ 22,000 – the price defined as the first Fibonacci target from the perspective of the daily chart.
Some relevant points are observed on the chart, such as the bullish and bearish trend lines, broken recently by the price, and the bullish divergence followed by the RSI.
It is also important to point out the tapering of the Bollinger bands, which indicates accumulated energy in prices. According to the analyst team at Transfero, as the breakout of this consolidation has just occurred, prices are likely to move with greater speed – in this case, upwards. The projected targets are in the image below.
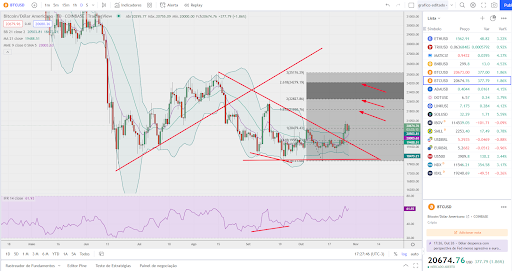
Chart generated by TradingView
From the weekly chart, the price is currently facing a natural barrier: the 21-period moving average. However, if it is overcome, it is still possible to form a double bottom, which, if triggered, would project the bitcoin price to the US$30,000 region.
But if this does not happen, the asset may continue its downward trend. If it loses the US$17,000, the next level is seen in the region of US$13,000, and the last at US$ 8,000 (worst case scenario). The targets of these moves can be seen in the following image.
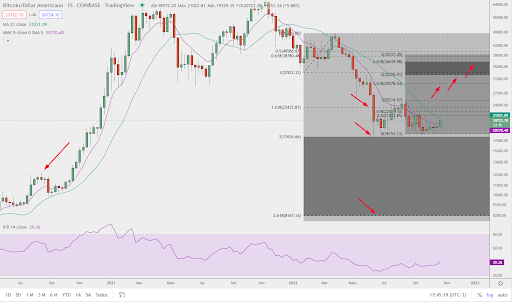
Chart generated by TradingView