
This study is based on the behavior of the bitcoin price in the last 15 days (ended August 25), with more complex elements of the analysis of the charts.
This time, starting with the weekly timeframe, represented by the medium/long-term horizon, a highlight is that bitcoin has respected the 9-period average, continuing the current bearish trend.
Thus, if the bearish flag that has been drawn is confirmed, the asset may seek the bottom set at the US$18,000 level. The red lines mark the nearest resistances and supports, barriers to the asset’s price. We can visualize this from the chart below:
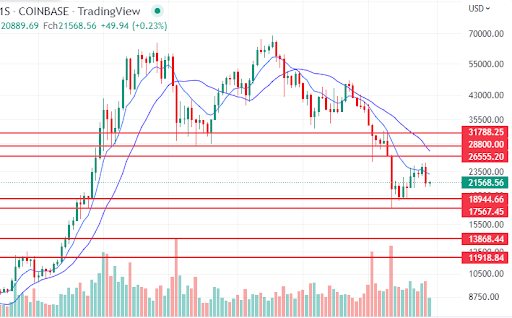
Chart generated by TradingView
From the perspective of the daily chart, the asset has drawn a triple bottom in the short term, which is a bearish to bullish trend reversal pattern; however, within a more significant bearish trend (by the weekly).
According to Transfero’s research team, this analysis shows the importance of using the confluence between charts of different periodicity.
“Continuing the analysis, bitcoin hit the targets determined by the Fibonacci projection, through the last leg of bearishness, marked by the red squares in the image below, which led to the price of US$ 23.8 thousand and, lastly, the US$25 thousand”.
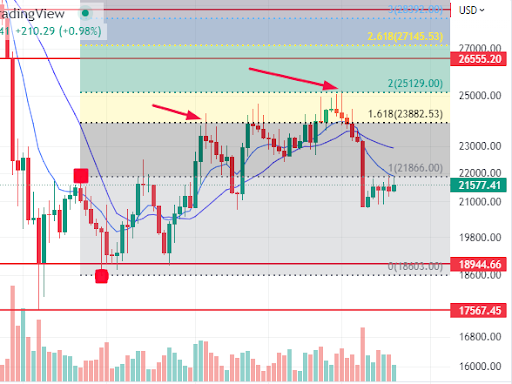
Chart generated by TradingView
According to Transfero analysts, after bitcoin reached the targets, it was possible to see a design configuring a reversal in price movement, known as bullish drift.
“Drift is a figure of reversal of the current price movement, featured by a tapering of prices over time. It is a kind of isosceles triangle with two congruent sides (of the same size). We can see that there was a breakout (downward, as expected) of this drift figure, after the asset has sought the second target at US$25,000”, explained the experts.
The figure below illustrates the above:
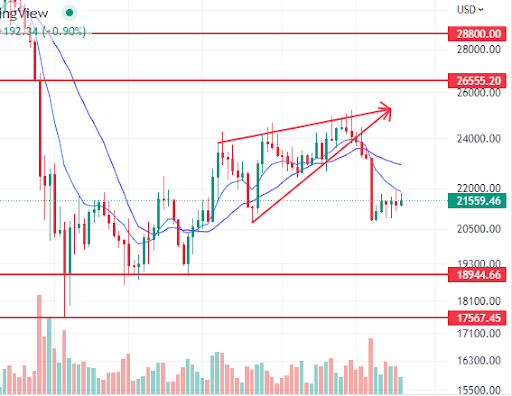
Chart generated by TradingView
Thus, with the continuation of the downtrend, now by both the weekly analysis and the daily chart, bitcoin can seek lower levels, such as US$18,000, since it is the first target of the Fibonacci projection (defined by the size of the drift formed) and support very well defined by the previous bottoms.
The US$ 16,000 range is calculated as the second target if this price is lost.
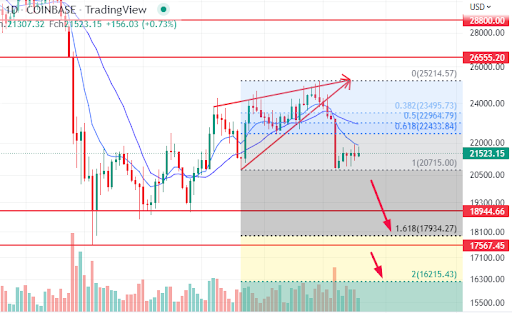
Chart generated by TradingView
Thus, it is essential to emphasize that at this moment, there should be caution in short-term operations since the current trend is down.
According to Transfero, in addition to this, there is a medium/long-term strategy, such as Dollar Cost Averaging (DCA), which is extremely relevant at this moment, not only because of the current trend but also because the asset has already accumulated a drop of approximately 70% in the year.
At Transfero Prime, you can access this strategy that allows you to build an average price in the long term without worrying about the operational and emotional aspects of trying to find the best price when buying the asset. Consult our team of Advisors for more information.